
Solar Exposure Lite shows the seasonal path of the sun in the camera view of your iOS device. Use it to plan where to place a garden, whether the sunlight in a new apartment is right for you, and other questions regarding how the natural lighting changes with the time of day and seasons. Here are sample indoor and outdoor views to give you an idea of what to expect from the app.
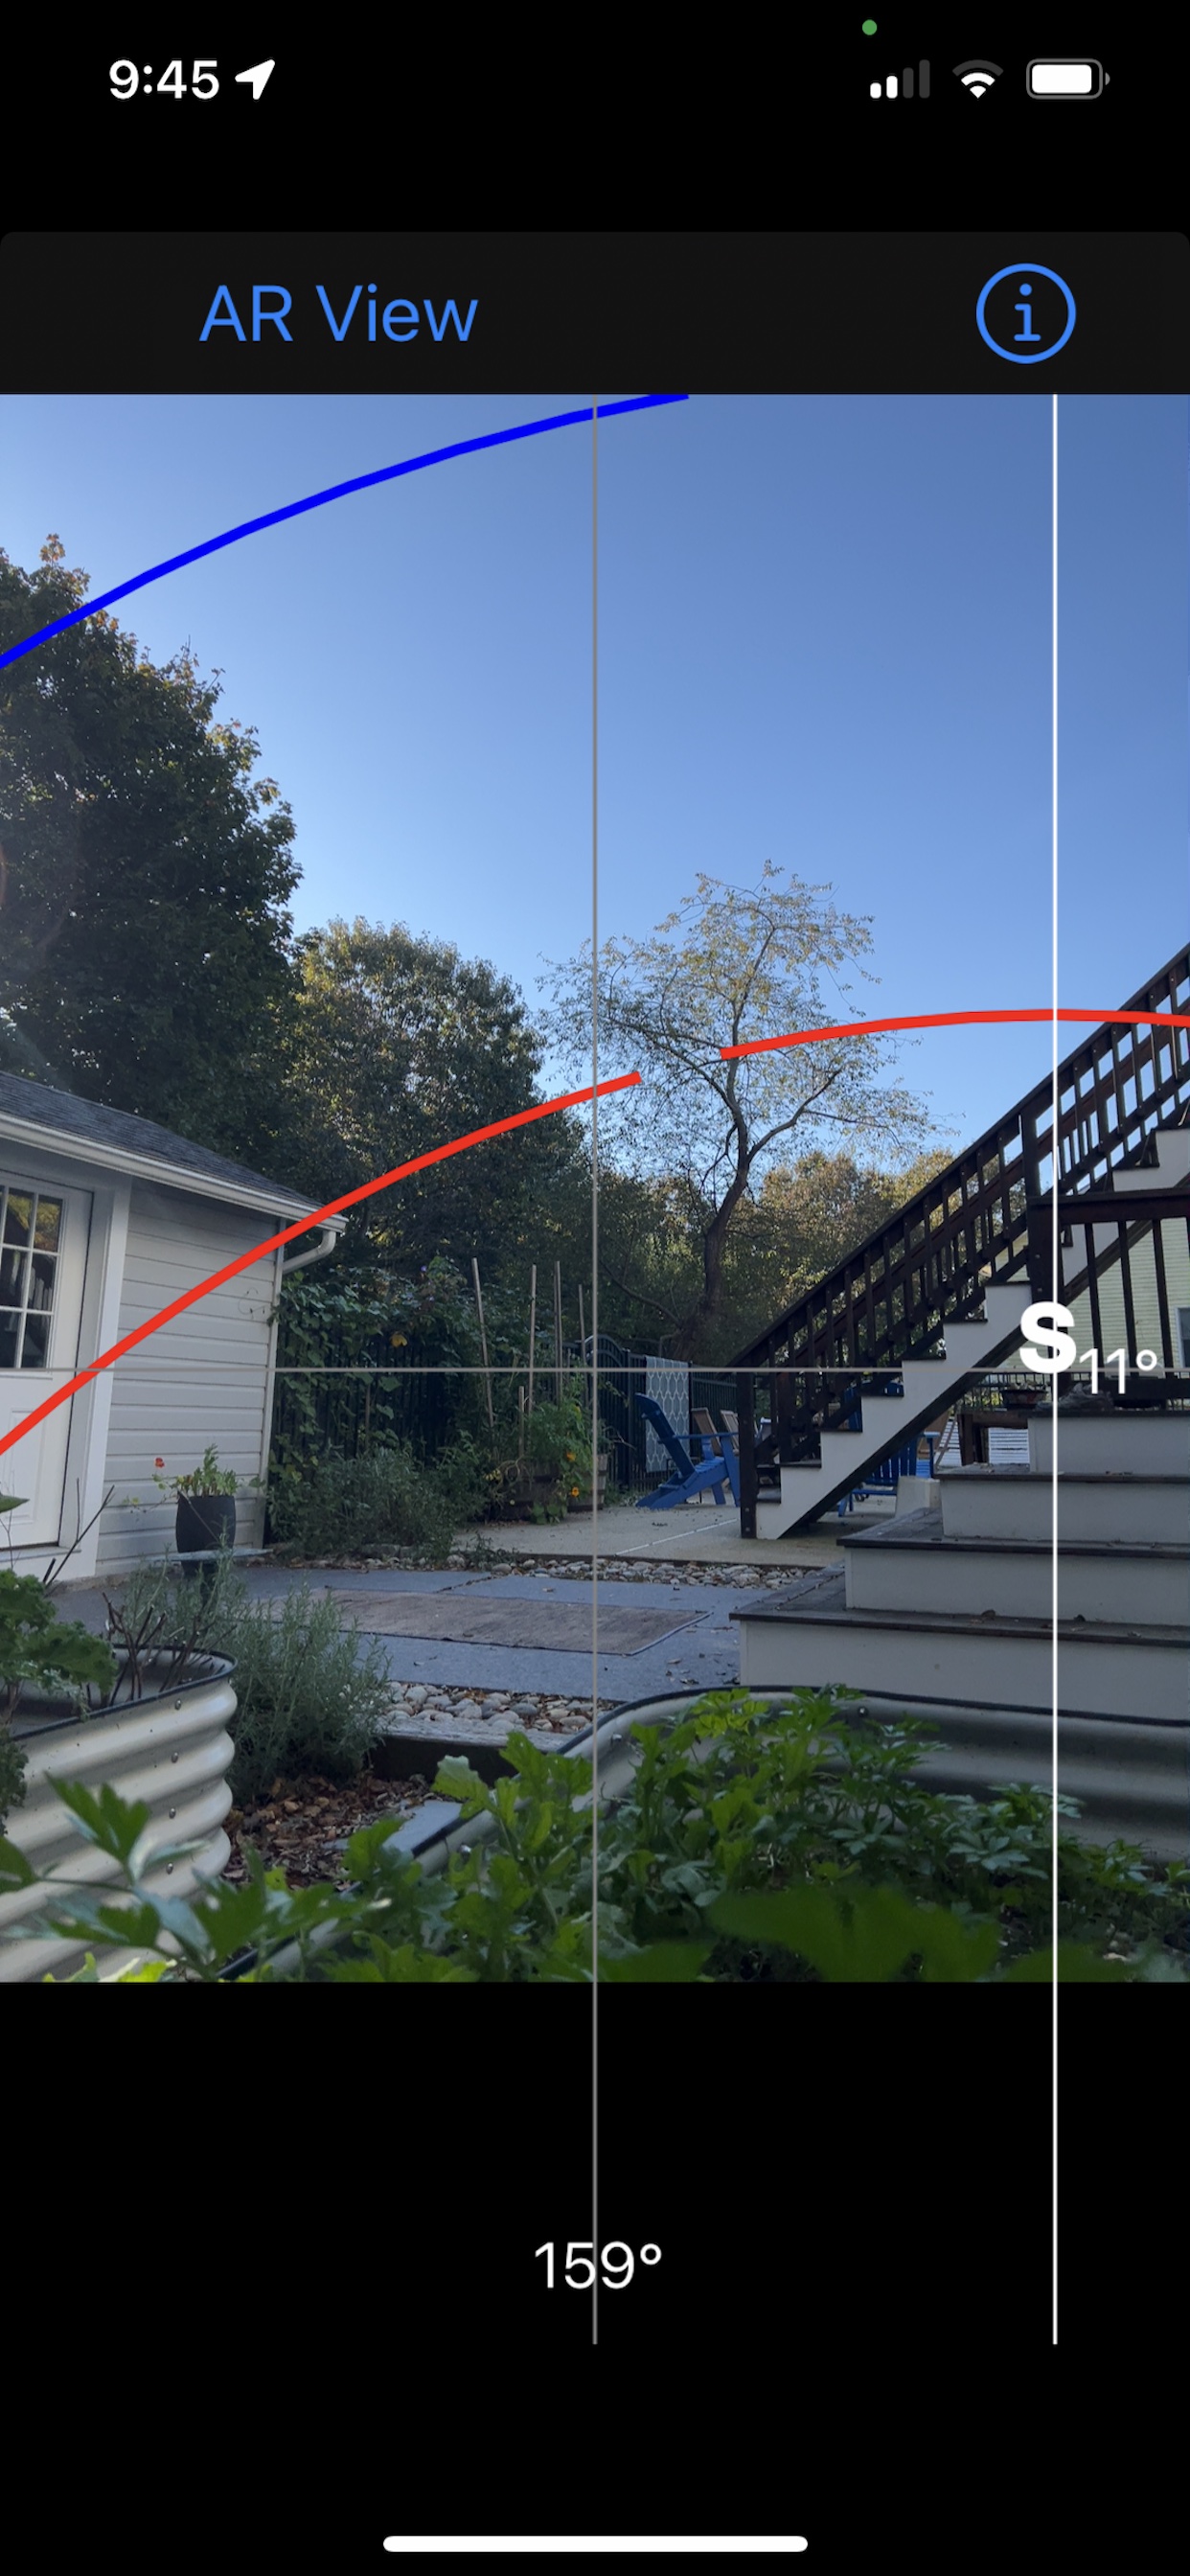


In the above augmented reality (AR) views, red is the path of the sun at the winter solstice (the shortest day), blue at the spring/fall equinoxes, and green at the summer solstice (the longest day).
How It Works
The solar path depends on your latitude, which is provided by the device’s GPS, and the time of year. Instead of plotting the path of the sun on a particular day Solar Exposure Lite plots its path on the solstices – the longest and shortest days when the sun is at its highest and lowest elevation, and in between (the equinox). The app uses standard astronomical models to determine the sun’s path. The following shows example plots (azimuth vs. elevation angle) at different latitudes.


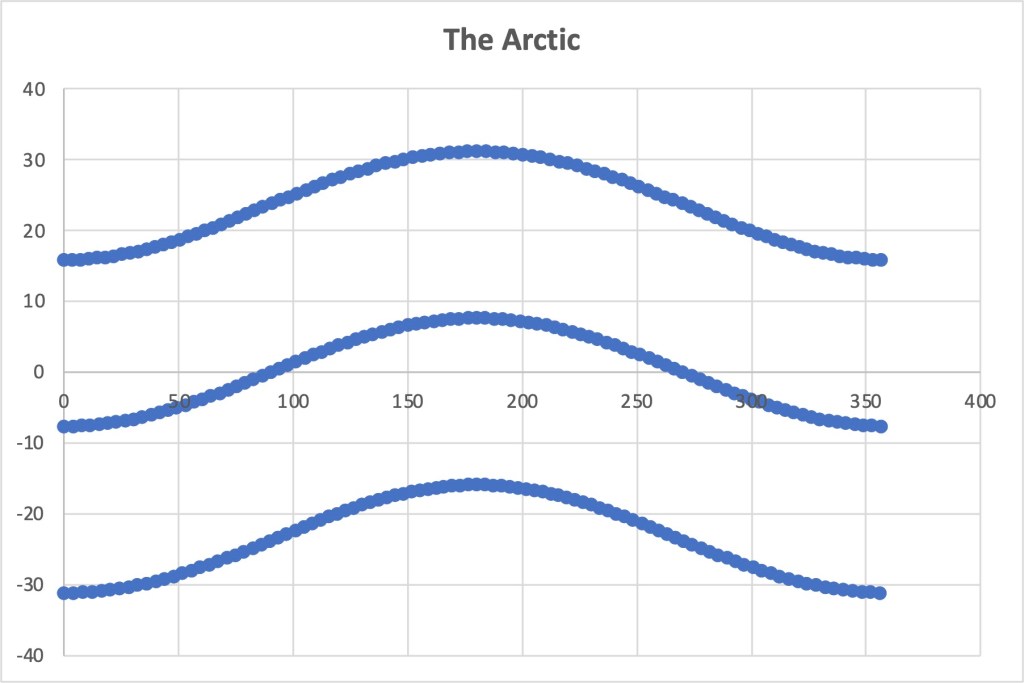
In these graphs, the azimuth angle (horizontal axis) goes from zero (north) to 90° (east), 180° (south), and 270° (west). The sun is above the horizon when the elevation angle (vertical axis) is greater than zero. Each graph plots three lines. The top line is the path of the sun on the summer solstice, the middle is the path of the equinox, and the bottom is the path on the winter solstice. During the course of year, the sun moves in the region of the sky between the summer solstice (the longest day) and the winter solstice (the shortest day).
The following screenshot shows position of the sun just before Halloween, which is between the equinox (blue line) and the winter solstice (red line).


Leave a comment